2.3.2.3 Data-snooping according to Baarda
The influence of a data error εi on the corresponding residual vi and on the solution vector x can be derived from equation (2.3.1/4).
If we assume only one data error and that a residual vi results from this single data error only, the size of this error ∇li (read: nabla li) can be estimated according to (2.3.1/4) from

The residuals vi are Gaussian distributed 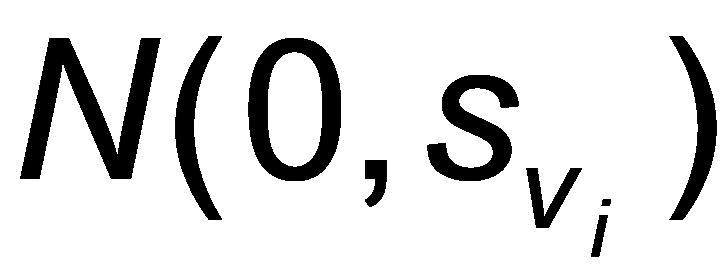 , with the expected value 0 and variance
  . If a critical value k is established a tolerance limit
  results which is only exceeded by the small probability α.

If, therefore
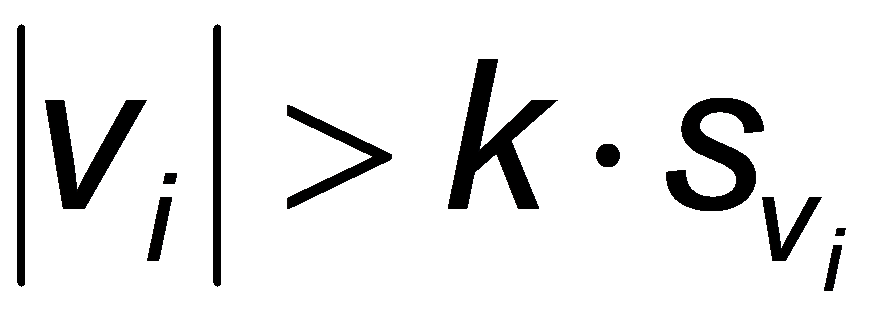
the measurement must be rejected. For α=0.003, k=3 is valid if the redundancy is large, i.e. a measurement is within the 3-σ limit with a probability of 99.7%. Standardisation N(0,1) of (2.3.2/5) leads to
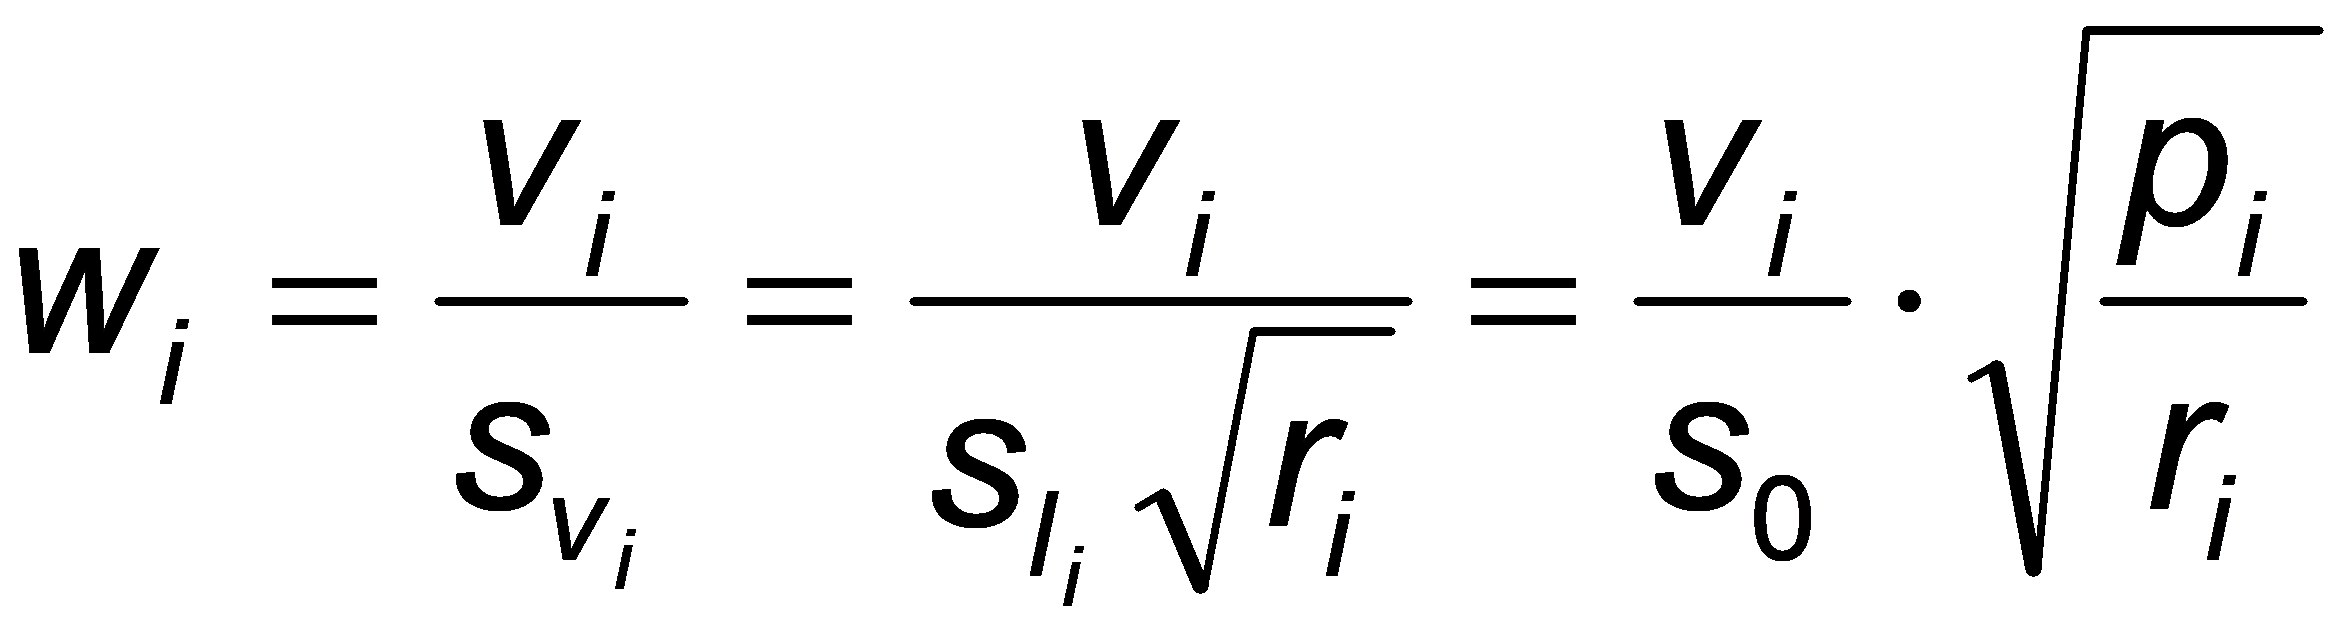
with the test

For practical application a value of k of 3.0 (corresponding to 99.7%) to 3.3 (corresponding to 99.9%) can be recommended.
This statistical test (equation 2.3.2/7) according to Baarda is carried out by BINGO if the option for data-snooping is activated.
The values for 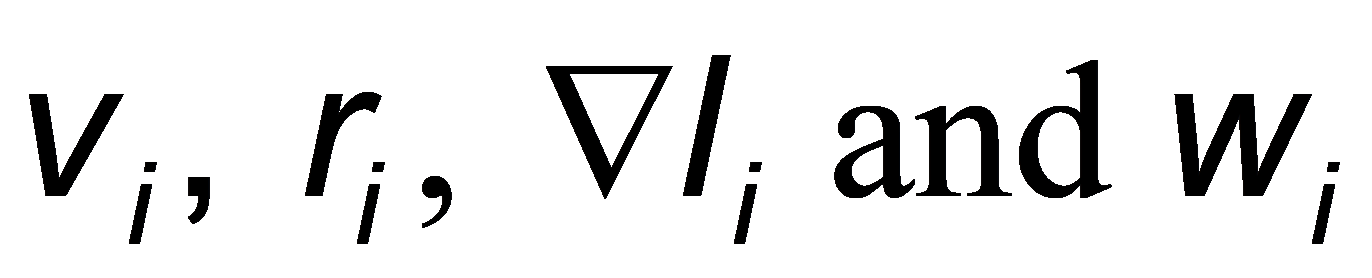 are printed. The number of stars printed as marker is derived from the integer part of
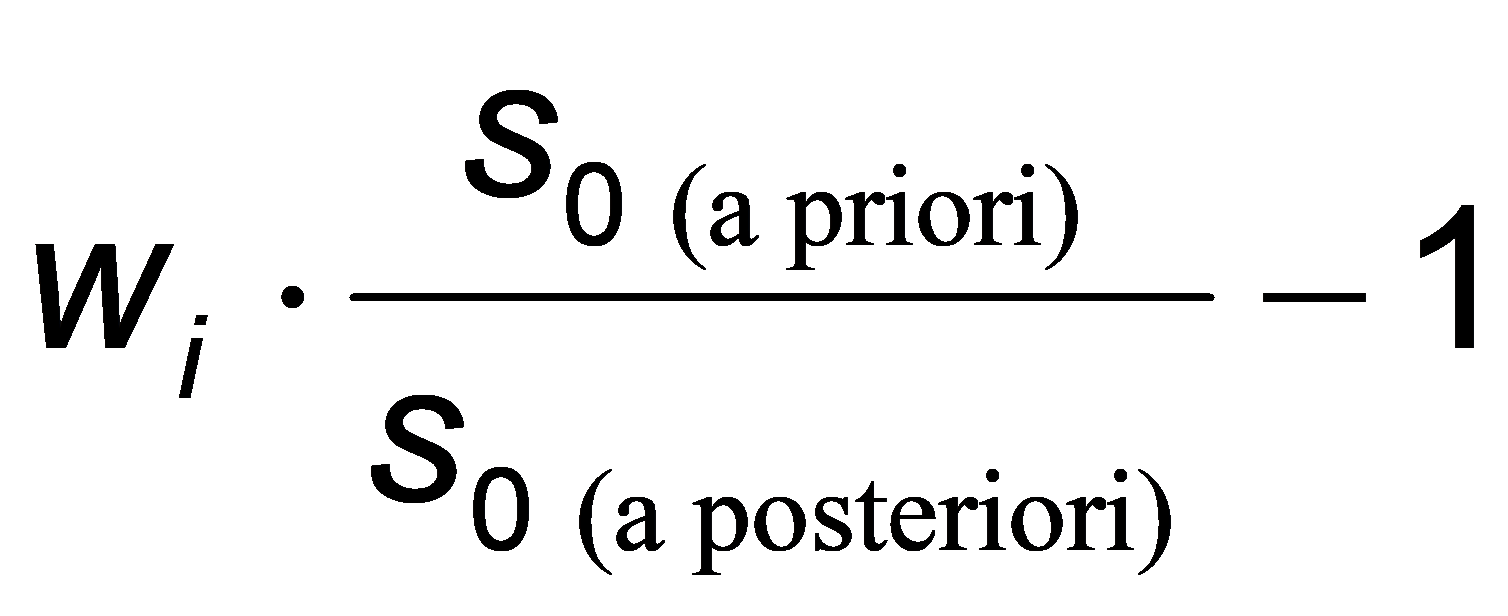
As this test assumes only one gross error, only one error (namely the one with the greatest value  ) can be detected because of the common influence of the residuals. If there are several large -values which do not result from common influences (because of the network geometry), several errors can be detected at the same time.
The test according to Baarda is much more powerful than the method described in Section 2.3.2.2, as according to Baarda the standard deviation (great computation effort) of the residual is introduced (see 2.3.2/6) which is only roughly approximated by the standard deviation  of the observation.
The values ∇li can assume unrealistically high values, however, especially for redundancy components  , as in such cases (2.3.2/3) is only a rough approximation. The residual vi is then often more strongly influenced by errors in other observations than by errors in the corresponding observation li .